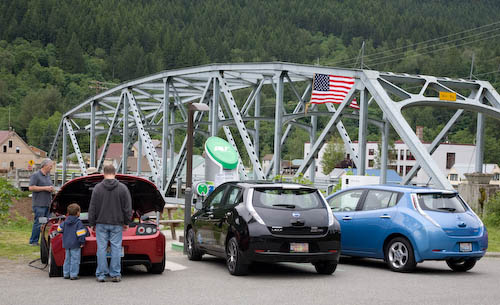
Electric vehicle drivers are excited to see the first DC Quick Charge stations coming online. Oregon and Washington have done their part to power up the West Coast Electric Highway allowing electric vehicle drivers to travel I-5 from the Canadian border to the Oregon-California border and take advantage of stations that can charge a Nissan LEAF or Mitsubishi iMiEV from empty to 80% in about half an hour. This greatly increases the usable range of electric vehicles for longer trips and also provides a safety net for rare situations when drivers unexpectedly need more than their normal overnight charge.
Unfortunately, there's a problem that is causing a lot of confusion that can result in a driver getting less charge than needed. Even though the stations are working properly, drivers may think something went wrong because of a user interface issue.
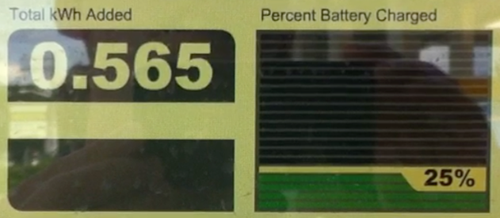 The above is the screen from an AeroVironment DC Quick Charge station in Tumwater, WA, as shown while charging our Nissan LEAF in June. The screen shows the driver two pieces of information: the amount of energy delivered to the car and a charge percent.
The problem is the displayed charge percent: it is not the car's state of charge (SOC) and should not be treated as such by a driver to decide when to end the charge.
It's pretty well known that it's difficult to determine the exact SOC of a car's battery. Even the best estimate of the battery's SOC may be off by a few percent. That's not what's going on here. The SOC value reported to the station is completely artificial and differs significantly from the car's estimate of the true SOC.
In addition to showing the invalid SOC value to the driver, Blink quick charge stations also require the user to choose a station-controlled charge limit. This has two big problems. First, the LEAF wants to control the charge and will stop the charge at either 80% or near 100% based on the battery state at the start of the charge, so even if you choose 100% on the station the LEAF will terminate the charge at 80% if the car was at 50% or less when the charge started. Second, the Blink station doesn't know the real state of charge and therefore cannot know when to stop charging at the point it says it will.
Here's an example. I recently used the Blink quick charge station at Harvard Market in Seattle, WA. I arrived with just over a half charge remaining, which means the LEAF will allow me to do a full quick charge up to near full capacity. After plugging in the car, the screen on the Blink station gave me a choice of charge levels, defaulting to 80%, which was the highest level shown. I had to press a "more options" button to be able to choose a 100% charge. The graph below shows data collected from the resulting 52-minute charge, comparing the car's actual SOC with the SOC shown on the station's screen.
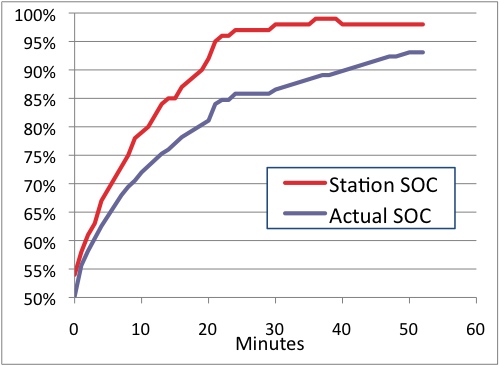 As you can see, not only is the reported SOC higher than the actual SOC, the reported SOC rises more quickly, increasing the gap as the charge progresses. Throughout the entire charge, the SOC shown on the station consistently overstates the actual charge level and the problem gets worse later in the charge period. As the car gets to about 80% actual SOC, the reported SOC jumps up to plateau near 100% and just sits there for the remainder of the charge, even though the car is far from fully charged.
Had I left the default 80% setting, the charge would have stopped when the reported SOC hit 80%, but the car was really only at 73% at that time. A requested 90% charge would have stopped around 80% actual.
Any driver who sees this behavior and doesn't know that the charge percent value on the station is not the SOC would see it jump up to 97%, perhaps watch it sit there for a few minutes, and likely decide that it would be a waste of time to spend any longer waiting for that last 3%. If the driver ends the charge at that point, the car will be missing perhaps 10% of the potential charge. If that last 10% is needed to finish the journey, this could result in a very unhappy EV driver.
It's not clear where this value comes from, but displaying this invalid SOC on the quick charge stations has created user interface problem with unfortunate consequences for LEAF owners, and perhaps iMiEV owners as well.
So to any EV driver using a CHAdeMO quick charge station that shows an SOC percentage:
1. Ignore what the station shows. Put a sticky over it if you have to. Only look at the car's representation of the SOC.
2. If the station offers you different charge levels, choose 100% charge so that you get the car's best available charge level. If you want to stop the charge early for some reason, do it based on the SOC shown by the car.
I'll contact the quick charge station manufacturers to make sure they are aware of this problem. In the meantime, please help spread the word so EV drivers can get the maximum benefit from these highly valued stations.
For charts of two AeroVironment quick charge sessions, see Cathy Saxton's report. More tips for using quick charge stations are available on our Avoiding Quick Charging Pitfalls page.
Unfortunately, there's a problem that is causing a lot of confusion that can result in a driver getting less charge than needed. Even though the stations are working properly, drivers may think something went wrong because of a user interface issue.
The above is the screen from an AeroVironment DC Quick Charge station in Tumwater, WA, as shown while charging our Nissan LEAF in June. The screen shows the driver two pieces of information: the amount of energy delivered to the car and a charge percent.The problem is the displayed charge percent: it is not the car's state of charge (SOC) and should not be treated as such by a driver to decide when to end the charge.
It's pretty well known that it's difficult to determine the exact SOC of a car's battery. Even the best estimate of the battery's SOC may be off by a few percent. That's not what's going on here. The SOC value reported to the station is completely artificial and differs significantly from the car's estimate of the true SOC.
In addition to showing the invalid SOC value to the driver, Blink quick charge stations also require the user to choose a station-controlled charge limit. This has two big problems. First, the LEAF wants to control the charge and will stop the charge at either 80% or near 100% based on the battery state at the start of the charge, so even if you choose 100% on the station the LEAF will terminate the charge at 80% if the car was at 50% or less when the charge started. Second, the Blink station doesn't know the real state of charge and therefore cannot know when to stop charging at the point it says it will.
Here's an example. I recently used the Blink quick charge station at Harvard Market in Seattle, WA. I arrived with just over a half charge remaining, which means the LEAF will allow me to do a full quick charge up to near full capacity. After plugging in the car, the screen on the Blink station gave me a choice of charge levels, defaulting to 80%, which was the highest level shown. I had to press a "more options" button to be able to choose a 100% charge. The graph below shows data collected from the resulting 52-minute charge, comparing the car's actual SOC with the SOC shown on the station's screen.
As you can see, not only is the reported SOC higher than the actual SOC, the reported SOC rises more quickly, increasing the gap as the charge progresses. Throughout the entire charge, the SOC shown on the station consistently overstates the actual charge level and the problem gets worse later in the charge period. As the car gets to about 80% actual SOC, the reported SOC jumps up to plateau near 100% and just sits there for the remainder of the charge, even though the car is far from fully charged.Had I left the default 80% setting, the charge would have stopped when the reported SOC hit 80%, but the car was really only at 73% at that time. A requested 90% charge would have stopped around 80% actual.
Any driver who sees this behavior and doesn't know that the charge percent value on the station is not the SOC would see it jump up to 97%, perhaps watch it sit there for a few minutes, and likely decide that it would be a waste of time to spend any longer waiting for that last 3%. If the driver ends the charge at that point, the car will be missing perhaps 10% of the potential charge. If that last 10% is needed to finish the journey, this could result in a very unhappy EV driver.
It's not clear where this value comes from, but displaying this invalid SOC on the quick charge stations has created user interface problem with unfortunate consequences for LEAF owners, and perhaps iMiEV owners as well.
So to any EV driver using a CHAdeMO quick charge station that shows an SOC percentage:
1. Ignore what the station shows. Put a sticky over it if you have to. Only look at the car's representation of the SOC.
2. If the station offers you different charge levels, choose 100% charge so that you get the car's best available charge level. If you want to stop the charge early for some reason, do it based on the SOC shown by the car.
I'll contact the quick charge station manufacturers to make sure they are aware of this problem. In the meantime, please help spread the word so EV drivers can get the maximum benefit from these highly valued stations.
For charts of two AeroVironment quick charge sessions, see Cathy Saxton's report. More tips for using quick charge stations are available on our Avoiding Quick Charging Pitfalls page.