Hi, this is Cathy; I'm guest-blogging on Tom's page, and he's playing editor this time!
We recently needed to drive approximately 80 miles (one way) to get to clearer skies for viewing the Venus transit. That provided a great opportunity to try out DC quick charging (DCQC) with our LEAF.
We charged up to full in Bellevue using Level 2 charging, drove to the Tumwater DCQC station, charged back to full while we watched the transit, and returned home to Sammamish.
Data Collection
We have one of Gary Gidding's SOC Meters. It shows a state-of-charge (SOC) percent, which it calculates from a raw energy unit reported on the car's CAN bus. The meter can be set to show the raw energy unit, which the LEAF community has dubbed a "gid." It is reasonably well established that a gid represents 80 watt-hours (Wh). Gids are divided by 281 to approximate an SOC %.
Note that the pack kWh is not something that can be directly measured. The car determines this value through sophisticated measurements and calculations, which result in periodic adjustments that are seen as "jumps" in the gids.
Charging
We arrived in Tumwater with 2 bars, or more precisely 61 gids, which translates to 4.88 kWh, or 21.7%.
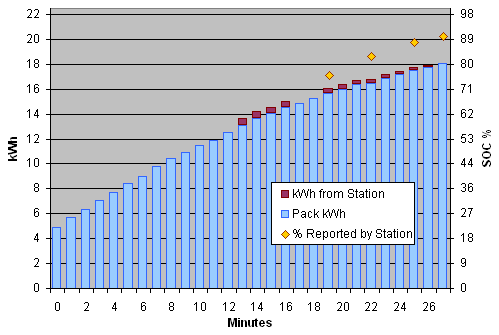
Since we were under 50%, our (first) DC quick charge brought us to 80%. The car charged for approximately 26:40 minutes, at which point it was showing 226 gids (18.08 kWh, 80.4%). The station reported having provided 14.36 kWh, and the car showed a net gain of 13.20 kWh.
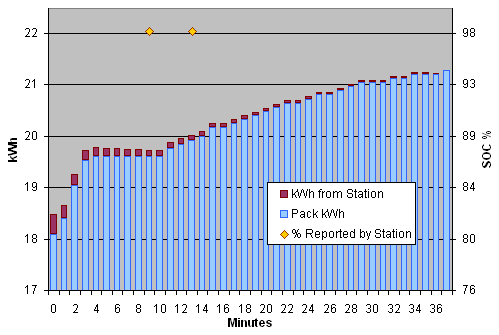
The graph below shows the status each minute during charging. The lower blue bar shows the energy in the car's pack at the beginning of the time interval. The upper red bar shows how much energy was supplied by the station during the time interval. You can see that the total energy (existing + added) closely matches the pack kWh at the beginning of the next time period. (We only logged the station-reported kWh for some of this charge session.)
The SOC % axis is scaled to correspond to kWh values (both graphs).

It is interesting to note that the SOC % reported by the station (gold dots) does not match the SOC % of the car. We are not sure what causes this discrepancy, but we've seen this consistently in subsequent DCQC sessions.
We expected to need more than 80% charge to make it home, and we wanted to see how to handle getting a full charge after arriving at a station under 50%. So, after the first charging session stopped at the expected 80%, we unplugged and returned the connector to the station. Then we initiated another charging session.
Our second DCQC charge took 36:35 minutes, increasing the car's charge to 266 gids (21.28 kWh, 94.7%). The station supplied 3.609 kWh and the car's charge increased by 3.2 kWh.

At the end of the second charge, the battery temperature was registering 6 bars. Ambient temperature was 61° F.
Driving

We have monitored gids and miles driven over several recent drives. For freeway and combined freeway / surface-street driving we see typical energy use in the range of 250 to 280 Wh/mi, with extreme readings as low as 230 or as high as 290.
The image on the left is after we had driven 74 miles from Tumwater to Issaquah. Stopping for dinner won out over completing the drive home and growing more trees.
Data from our drives to and from Tumwater:
| miles | Wh / mi | Notes |
| 65.9 | 251 | Bellevue - Tumwater |
| 79.1 | 235 | Tumwater - Sammamish, slow freeway traffic for several miles |
Details on a few legs of the trip from Bellevue to Tumwater.
| miles | Wh / mi | Notes |
| 23.6 | 247 | Freeway, uneven speeds (traffic, merges, etc), partially rainy |
| 15.7 | 255 | Cruise at 60 |
| 7.1 | 259 | Cruise at 60 |
Gids in Relation to Bars

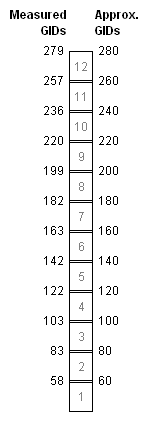
The bars are based on an approximation of the percentage of the maximum available energy. This maximum varies with temperature as well as with battery age as capacity is reduced.
Therefore, there is not a static gid-to-bar mapping; it will vary based on current conditions. The image on the right shows gid readings that we observed as bars dropped during driving. It also shows a simple approximation of the gid values at the bar transition points. Since the gid values tend to vary a little anyway, those values should be an easy way to get a pretty close approximation to the actual kWh (gids × 0.08) remaining in the pack. (The gid range will be between approximately 20 × bars + 20 and 20 × bars + 40.)
Don't forget that there is some amount at the bottom (2%?) that is unavailable; the car will shut down before letting you deplete the battery that far.
When we got to approximately 50 gids, the LEAF warned us of low charge with the following:
- Warning message ("Battery level is low") on the dot matrix liquid crystal display just above the steering wheel.
- Illumination of the low battery charge warning light (the icon showing a pump with a plug).
- Flashing driving range (affectionately known in the LEAF community as the Guess-O-Meter).
We arrived home with 35 gids remaining and did not see the turtle.
