Note that the graph cuts off the last three hours of the 16A charge. The 120V charging graphs aren't shown. A full standard mode charge at 120V/16A takes about 38 hours and at 12A it takes about 60 hours.Note that the graph cuts off the last three hours of the 16A charge. The 120V charging graphs aren't shown. A full standard mode charge at 120V/16A takes about 38 hours and at 12A it takes about 60 hours.Updated: April 17, 2011 to add 120V charging data.
Another aspect of charging is that for any given current setting, the Roadster will charge steadily at that current until it gets near the top of the charge, at which point it will start to taper off. This reduces your charge rate near the top of the pack. This aspect of charging isn't documented in the owners manual.
If I don't care about charging time, what's the best amperage for energy efficient charging? If I'm on a road trip and want to squeeze the most range out of time spent at a charging stop, how should I space my stops and how long should I charge at each one? I've collected enough data to shed some light on these questions.
Methodology
I performed a series of charges at various current levels from relatively low battery states up to a full standard mode charge. For each charge, I collected time, voltage and amperage once per minute, and state of charge once every 10 minutes. From that, I can compute energy used during every segment of the charge and the total energy used.
To track our energy use for driving, we have a dedicated electric meter for each of our EVs. To validate my energy calculations, I verified that the total energy calculated per charge matches the value computed from the meter readings.
All charging was done overnight in cool weather with a 2008 Roadster. The 16A charge was done with firmware version "3.5.17 15", all other runs were done with firmware version "3.4.17 15". The 16A charge stopped at a lower state of charge (96%, 188 IM) than I normally see (98%, 193 IM). I don't know if this is due to the lower current limit, the new firmware, or a one-time fluke.
Charging Efficiency Results
Is
it more efficient to charge at a low rate or a high rate? Here are the results:
| Charge Rate | Wh per Std % | Wh per Ideal Mile |
| 120V - 12A | 807 | 414 |
| 120V - 16A | 723 | 371 |
| 240V - 16A | 589 | 306 |
| 240V - 24A | 544 | 282 |
| 240V - 32A | 527 | 274 |
| 240V - 40A | 512 | 266 |
| 240V - 48A | 524 | 272 |
| 240V - 70A | 516 | 268 |
As you can see from the table, there's not much variation in charging efficiency when charging at or above 240V at 32A, but energy use rises noticeably at lower power levels.
Road-tripping and Charging Rates
Also of interest are the charging rates at various current levels. This is especially important when charging away from home.
Charging at higher currents is faster than lower current, but by how much? Is it worth it to drive 55 mph in order to make it to a 40A charge point instead of driving faster and stopping sooner at a 24A or 32A charging spot? Tesla gives us a table on charging rates, but it's pretty low resolution.
How far can I charge before I start getting diminishing returns because of the current tapering that happens near the top of the charge? Tesla is silent on this subject.
If you care about getting the most out of your charging stops, you may be in Range Mode, so this table shows both standard and range mode values for when current begins to taper off.
| Charge Rate | Ideal Miles per Hour | Current Tapering Begins At: | |||
| Std % | Std IM | Range % | Range IM | ||
| 120V - 12A | 3.3 | ||||
| 120V - 16A | 5.1 | ||||
| 240V - 16A | 13 | 93 | 179 | 82 | 205 |
| 240V - 24A | 20 | 94 | 180 | 82 | 205 |
| 240V - 32A | 28 | 93 | 178 | 82 | 207 |
| 240V - 40A | 36 | 93 | 178 | 81 | 204 |
| 240V - 48A | 42 | 91 | 174 | 80 | 201 |
| 240V - 70A | 61 | 84 | 161 | 75 | 188 |
Let's assume I want to get the most range for time spent charging, and don't need to charge all the way to the top. From the above table we see that if I'm charging at 48A or lower, I can expect to see the charging rate start to taper off at around 80% or a bit over 200 ideal miles (range mode). If I'm lucky enough to be charging at 70A on the road, my charge rate will start dropping around 75% or 188 ideal miles. I'll keep charging above 40A until I hit that 80%/200IM mark, so if my next charging stop is only 40A, I may as well keep charging to that point.
I'm sure there's some variation from car to car, and the pack and ambient temperatures will change charging behavior, so don't plan your trip to depend on these exact values, but this is at least a rough guide.
Charging Profile Graphs
Let's start by looking at how the state of charge varies over time using different current limits at 240V. All charges are standard mode all the way up and normalized so that all the charge sessions are shown from the same starting point, around 36%.
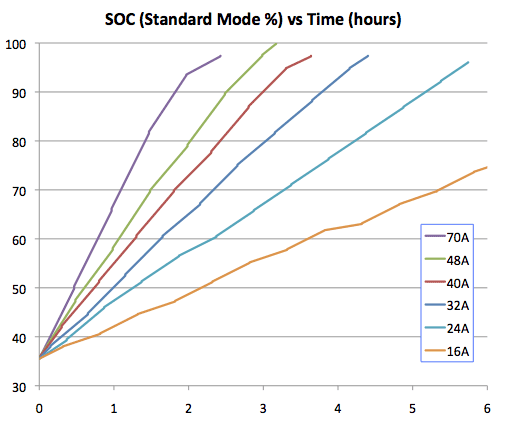
You can see how more current yields a faster charge, and that the rate of charge starts to drop off as the battery pack gets near the 100% mark.
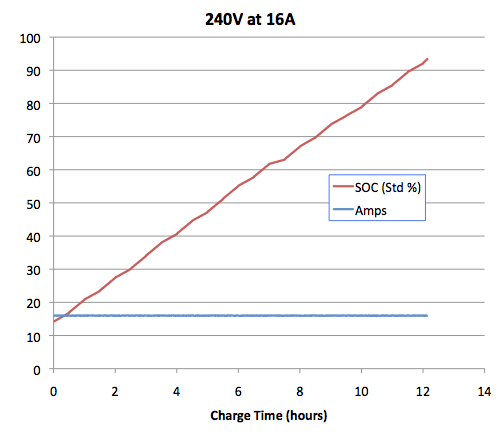
Note that the graph cuts off the last three hours of the 16A charge. The 120V charging graphs aren't shown. A full standard mode charge at 120V/16A takes about 38 hours and at 12A it takes about 60 hours.
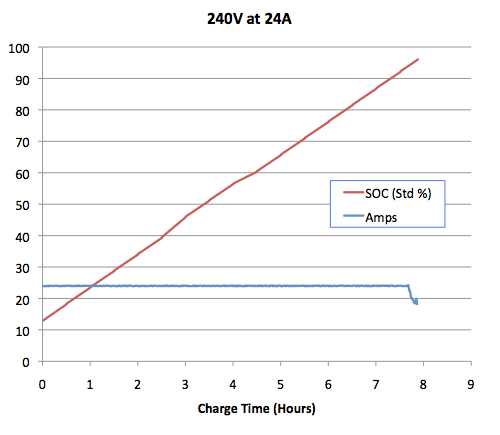
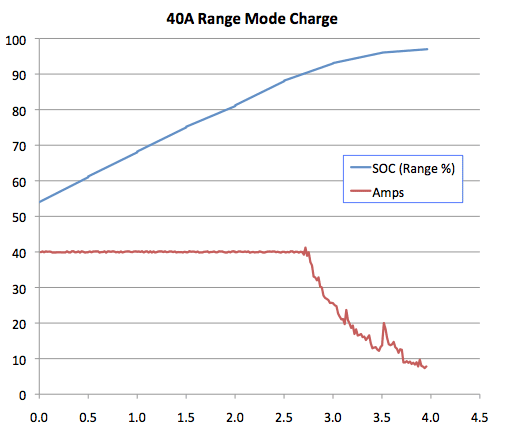
Now let's examine current draw and state of charge throughout each of the current settings. In each session, the car draws an approximately constant amount of current until near the top of the charge when it begins to taper off. The following graphs show current drawn (in amps) and state of charge (as standard mode percent) as a function of charge time in hours. Each charge begins at a slightly different level, but all start below 40% so they have a nice long stretch of steady current draw.
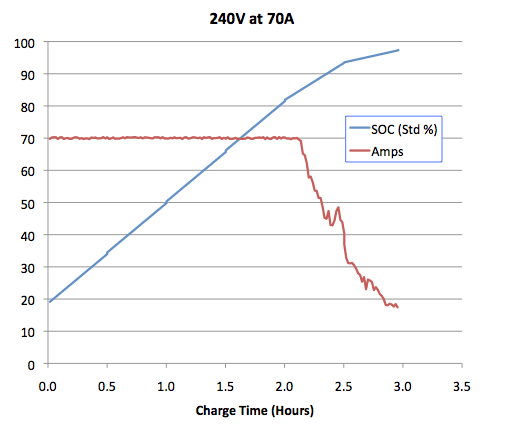
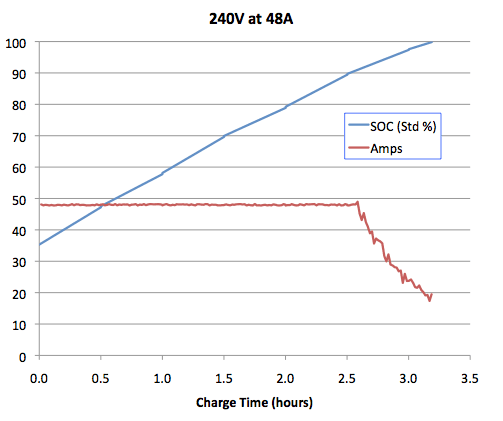
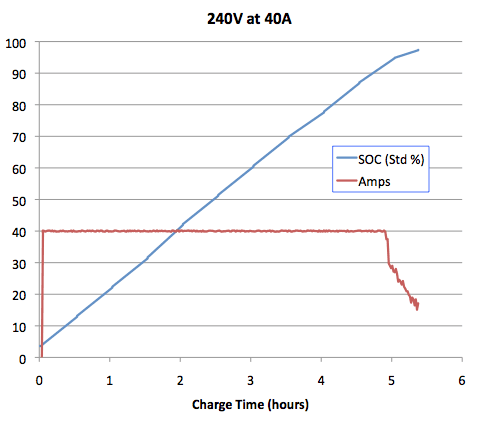
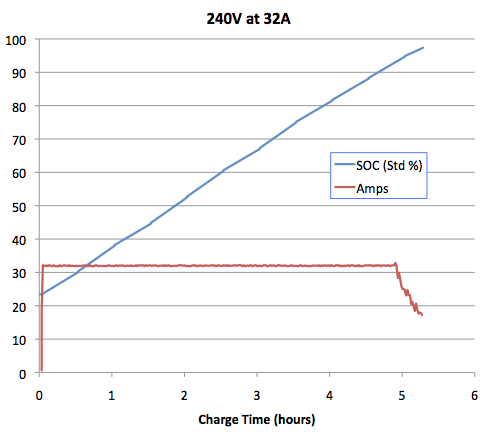
You may notice that at 32A and 40A, the rate at which the SOC increases doesn't drop off as much as you might expect from how quickly the current drops near the end. I attribute this to the SOC calculation stabilizing near the end of the charge. It's difficult to know how much charge is in a battery while you're charging it. My guess is that the SOC is an estimate that gets better near the end of the charge. Regardless, the less current you're drawing, the less power you're putting into the battery. I've seen behavior that leads me to believe that if you stopped the charge within the tapering zone, you'll see the SOC continue to rise for a bit as the software gets a better estimate of the charge in the pack. However, you're still getting diminishing returns on charge time once the current starts to taper.
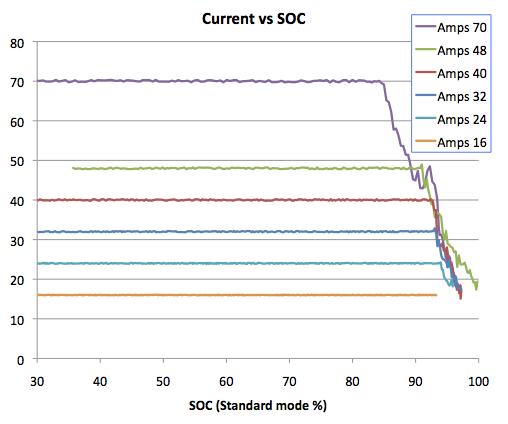
Another way to look at the data is to plot amperage draw as a function of state of charge. This will show us how the different charge limits compare with respect to when they start backing off from the full allowed current.
Charging in Range Mode
Each of the above graphs show a standard mode charge. In range mode, it makes the bottom part of the charge range available and charges the pack even further: 0% and 100% in standard mode correspond to 11% and 87% in range mode. The same charging profile is in play, so as the battery pack crosses beyond the top of the standard mode charge, the current draw drops even further.
Tesla says that the range of the Roadster is 244 miles and that it can be charged from empty to full in as little as 3.5 hours, but those two don't really go together. The 3.5 hour charge time is for a full standard mode charge which is less than 80% of the full range, around 195 miles. Getting the full range mode charge takes longer. For my car, it's about an hour and forty minutes to go from a full standard mode charge to a full range mode charge (and add more time if you start below 10% in range mode). So, if you're on the road trying to make good time, waiting the extra 1:40 for another 25 ideal miles is not worth it unless you need the full range to get to the next charging stop. Charging to the top of range mode only makes sense if you're charging overnight and don't care how long it takes. So, on an extended road trip, a full range mode charge is probably only useful at most once per day.
Topics for Further Research
I would like to add data for some more scenarios, most notably 120V/12A (the slowest of the options, which requires three days for a full standard mode charge).
It will be interesting to see how these graphs change over time as the battery pack ages.
Charging in a hot environment definitely changes energy consumption during charging because the fan and A/C will kick on to cool the battery pack. It's harder to control for ambient temperature across multiple charges, but it would be interesting to collect data and see how things change. I would not be surprised to see a significant penalty for charging at higher current if that pushes the temperatures high enough to require the A/C during the charge.
These results are for our Roadster, yours may be different. Even the conversion from standard mode percent and ideal miles to range mode may vary between vehicles and across firmware updates. Drop me a note if you want to learn how to do this analysis for your Roadster.
Collecting and processing the data to produce the charts is only partially automated. It would be nice to automate more of the process to make it easier to do the analysis for me and others who are interested in doing the same for their vehicles.
You may notice that at 32A and 40A, the rate at which the SOC increases doesn't drop off as much as you might expect from how quickly the current drops near the end. I attribute this to the SOC calculation stabilizing near the end of the charge. It's difficult to know how much charge is in a battery while you're charging it. My guess is that the SOC is an estimate that gets better near the end of the charge. Regardless, the less current you're drawing, the less power you're putting into the battery. I've seen behavior that leads me to believe that if you stopped the charge within the tapering zone, you'll see the SOC continue to rise for a bit as the software gets a better estimate of the charge in the pack. However, you're still getting diminishing returns on charge time once the current starts to taper.
Another way to look at the data is to plot amperage draw as a function of state of charge. This will show us how the different charge limits compare with respect to when they start backing off from the full allowed current.
From this, we can see that there's isn't a penalty for charging at higher amps. Although it starts tapering the current earlier, it hits the lower amperage levels at about the same point as charging at those amperage values would start tapering.
Charging in Range Mode
Each of the above graphs show a standard mode charge. In range mode, it makes the bottom part of the charge range available and charges the pack even further: 0% and 100% in standard mode correspond to 11% and 87% in range mode. The same charging profile is in play, so as the battery pack crosses beyond the top of the standard mode charge, the current draw drops even further.
Tesla says that the range of the Roadster is 244 miles and that it can be charged from empty to full in as little as 3.5 hours, but those two don't really go together. The 3.5 hour charge time is for a full standard mode charge which is less than 80% of the full range, around 195 miles. Getting the full range mode charge takes longer. For my car, it's about an hour and forty minutes to go from a full standard mode charge to a full range mode charge (and add more time if you start below 10% in range mode). So, if you're on the road trying to make good time, waiting the extra 1:40 for another 25 ideal miles is not worth it unless you need the full range to get to the next charging stop. Charging to the top of range mode only makes sense if you're charging overnight and don't care how long it takes. So, on an extended road trip, a full range mode charge is probably only useful at most once per day.
Topics for Further Research
I would like to add data for some more scenarios, most notably 120V/12A (the slowest of the options, which requires three days for a full standard mode charge).
It will be interesting to see how these graphs change over time as the battery pack ages.
Charging in a hot environment definitely changes energy consumption during charging because the fan and A/C will kick on to cool the battery pack. It's harder to control for ambient temperature across multiple charges, but it would be interesting to collect data and see how things change. I would not be surprised to see a significant penalty for charging at higher current if that pushes the temperatures high enough to require the A/C during the charge.
These results are for our Roadster, yours may be different. Even the conversion from standard mode percent and ideal miles to range mode may vary between vehicles and across firmware updates. Drop me a note if you want to learn how to do this analysis for your Roadster.
Collecting and processing the data to produce the charts is only partially automated. It would be nice to automate more of the process to make it easier to do the analysis for me and others who are interested in doing the same for their vehicles.