|
| Electric Vehicles | Overview | FAQ | Efficiency Analysis | Driver Resources |
Tom & Cathy's RAV4-EV
Charge and Discharge Data
Last Updated on June 7, 2010
We recently completed a process of completely discharging the RAV4-EV's battery pack, then fully charging it and recalibrating the SOC (State-of-Charge).
This process was motivated when we turned on the car one morning and its SOC gauge showed 0%. The pack and module voltages were still high, consistent with ~85% SOC that we'd seen after the previous night's charge. Tom likened it to a broken fuel gauge. After getting advice from other owners, we decided that all indications were that the battery pack in fact still had plenty of charge, and that the faulty SOC reading wouldn't cause the car to stop running. We tested this theory with a few laps around our circular driveway and it seemed to behave fine (except for the annoying flashing 'charge-me-now!' light).
Based on suggestions, we decided that the best way to solve this issue would be to use a Toyota hand-held tester (also called a scan tool or TDC [Toyota Diagnostic Checker]) to fully discharge the battery, recharge, and then recalibrate the SOC.
Thanks to everyone on the RAV4-EV list who provided help, insight, and sympathy. We are especially grateful to the generous owner who shared a tester so we could perform the discharge and recalibration; and to Len Fein for his advice and guidance on this process and helping Cathy not freak out (too much) when the pack and module voltages got to levels she thought were really low at the end of the discharge cycle.
General strategy: have the tester direct the car to discharge the pack (the car automatically stops at the appropriate level), let the batteries cool completely, then discharge again. Charge the car until it stops, then immediately issue the tester's SOC recalibrate command. (There is also a recalibrate command for 0% SOC, but we weren't aware of that until after we'd started charging.)
The procedure worked great. If anything, we have a bit more range now (based on watching SOC changes during 100+ miles of driving). We don't think there's anything actually improved with the battery pack, just a better understanding by the car.
Data
We logged data during the discharge and charge procedures. There are graphs below showing some of the results. Obviously, the details will vary from car to car, but we expect that the general behavior will be the same, and that others might find it interesting to see how various readings charged during the process.
In graphs below where module and pack voltages are on the same chart, the pack voltages have been scaled to correspond to the module voltages (i.e. pack = 24 x module).
In graphs showing module voltage, we've colored a few select modules to help make it easier to track performance. They were selected based on the graph in the 'Second Discharge' section below; weakest modules are in warm colors (magenta, red, orange, yellow), strongest modules are in cool colors (green, blue, purple), and all others are black. Each module uses the same color in every graph showing module voltages.
First Discharge
We successfully drove the car 13.2 miles while the SOC was stuck at 0%. At that point, we didn't have any further errands to run and decided that we didn't mind wasting the remaining charge (which we estimate was 70-75%) by just having the tester discharge it. It sounds like the typical procedure for an SOC recalibration is to drive the car down into the red and then do the tester-triggered discharge at that point. Since we didn't have any indication of where red should be, we decided it was safer (from a not-getting-stranded standpoint) to just discharge from the current level.
The procedure is very simple: the tester sends a command to the car, and then the car starts the discharge process. (There's also a command to stop the discharge.) Once the discharge is started, the tester can be used to check data; we logged that by watching the communication between tester and car.
It wasn't until several hours into the process that we determined that at the current rate, it would take about 50 hours for the discharge. The good news is that the low-current discharge meant it was being nice to the batteries. If we ever have to do this again, though, we'll drive it a bit more first.
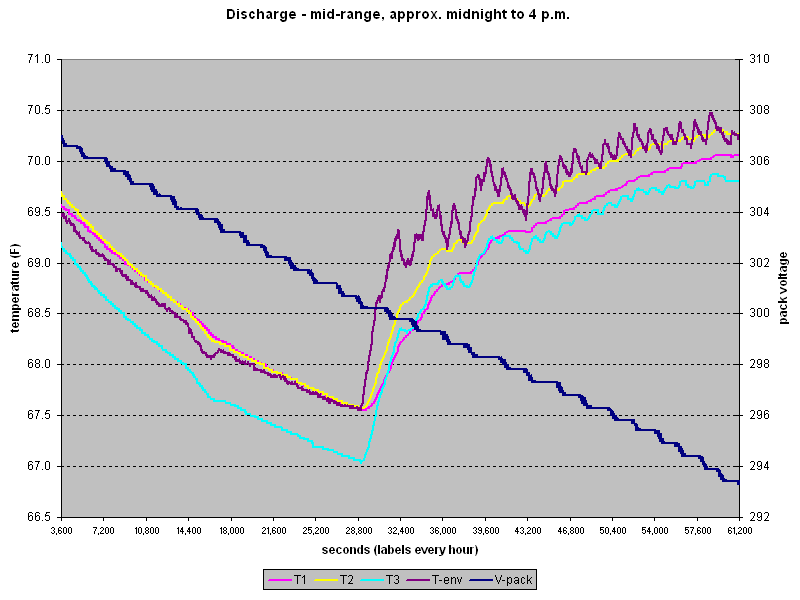
This graph shows the pack voltage and temperatures (3 in battery tray plus one environment).
It covers a period of 16 hours in the early-to-middle timeframe of the discharge.
The stair-step shape of the pack voltage was consistent throughout the discharge
and may just be an artifact of how the car calculates the pack voltage.
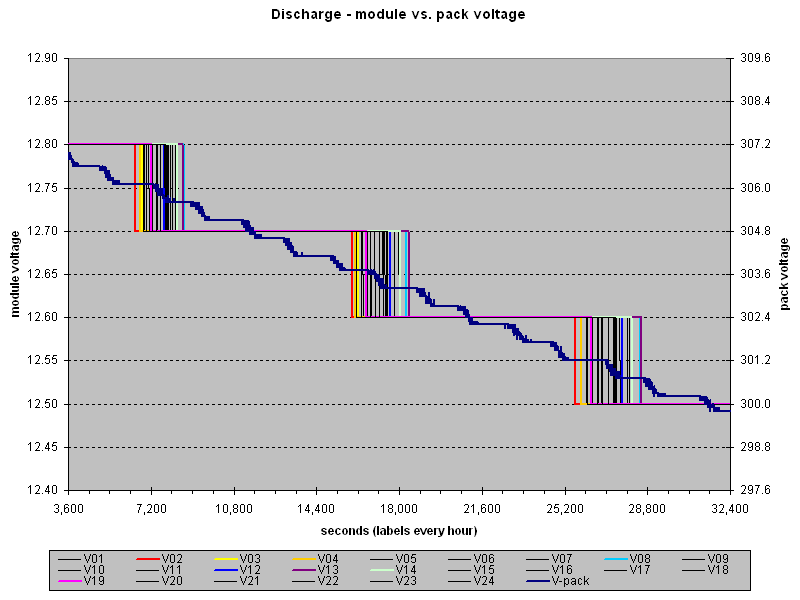
This graph covers the same time as the first half of the previous graph and shows how the
individual battery modules change in relation to the pack voltage (navy line).
Notice that the modules all tend to drop 0.1V (the resolution reported by the car) around the
same time, but that the timeframe gradually expands.
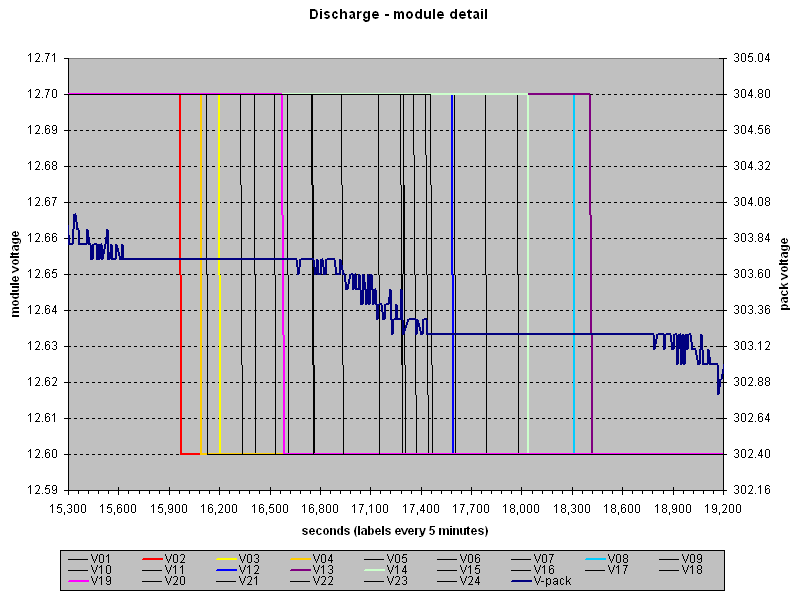
This graph covers a short period where each of the modules drops 0.1 volt. Notice that the
pack voltage has already dropped some prior to the modules reporting their voltage decrease.
The strong/weak modules here correlate closely, but not perfectly, with what's seen at the
end of charging and during the second discharge.
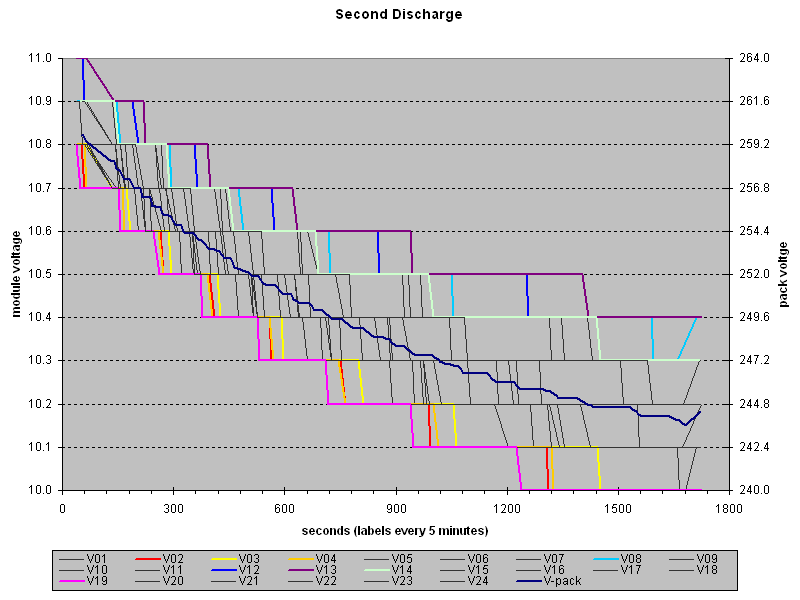
Second Discharge
After the batteries had a chance to cool down, we did a second discharge (as before, initiated by the tester). The rationale for this is that the batteries heat up as they are used, so end up showing an 'empty' indication before they're truly at that point. After cooling, they re-calibrate a bit.
This graph shows the entire time period for the second discharge, just under 30 minutes.
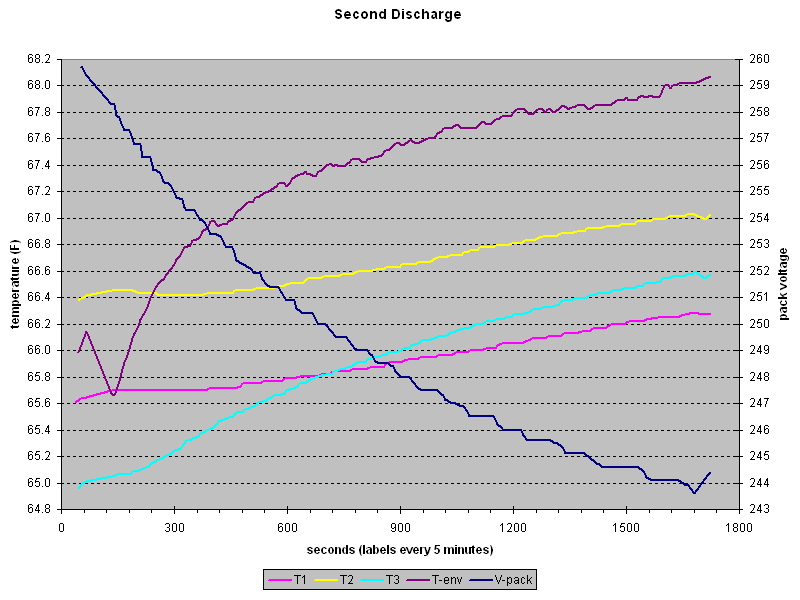
Module colors were assigned based on this graph. The four weakest (first to drop) are warm colors,
and the four strongest (last to drop) are cool colors.
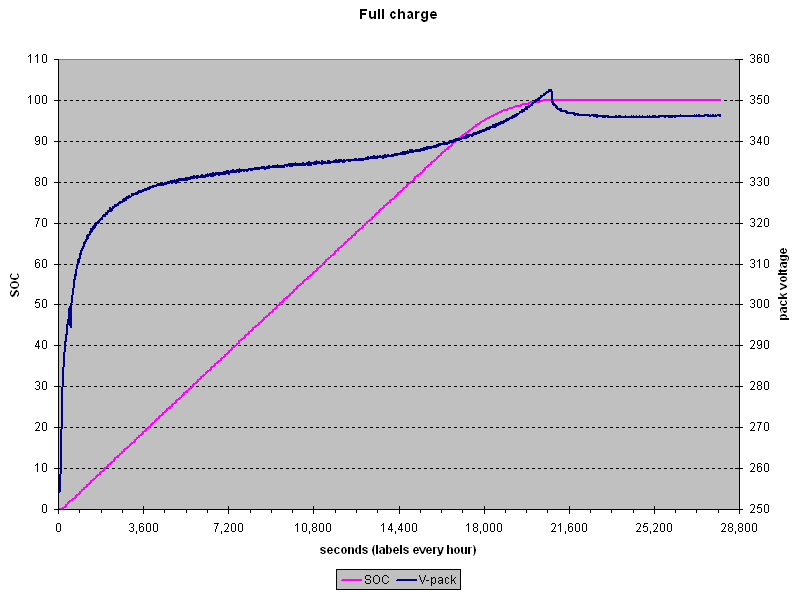
Full charge
After the second discharge, we let the batteries cool again, then plugged in the charger. When it reached 100%, we got a leveling charge. We don't know if that will always happen after a (tester-initiated) complete discharge, but we were happy that it happened this time!
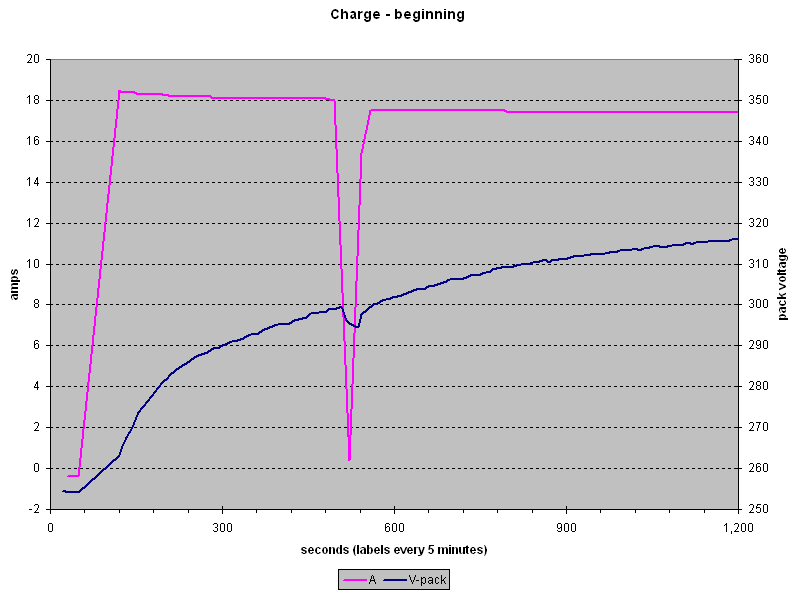
This graph shows the pack voltage and current over the entire time period for the charge and level.
Pretty obvious when leveling started, isn't it?! (Detail of the beginning portion is below.)

Full time period, showing SOC and pack voltage.
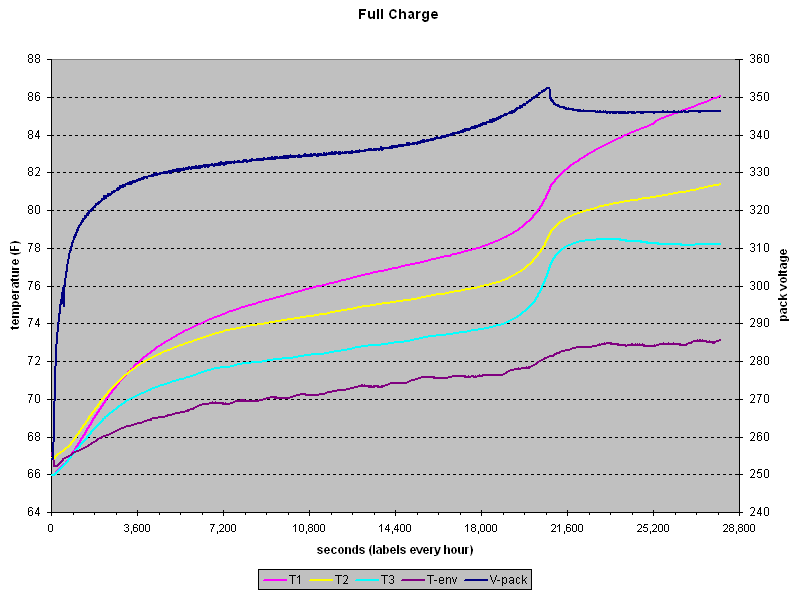
Full time period, showing temperatures and pack voltage.
This graph shows the detail of the current and voltage during the first twenty minutes.
Many owners have observed that the car seems to stop charging for a minute after charging
for about 7 minutes. This can be seen any time charging is done, not just at low SOC values.
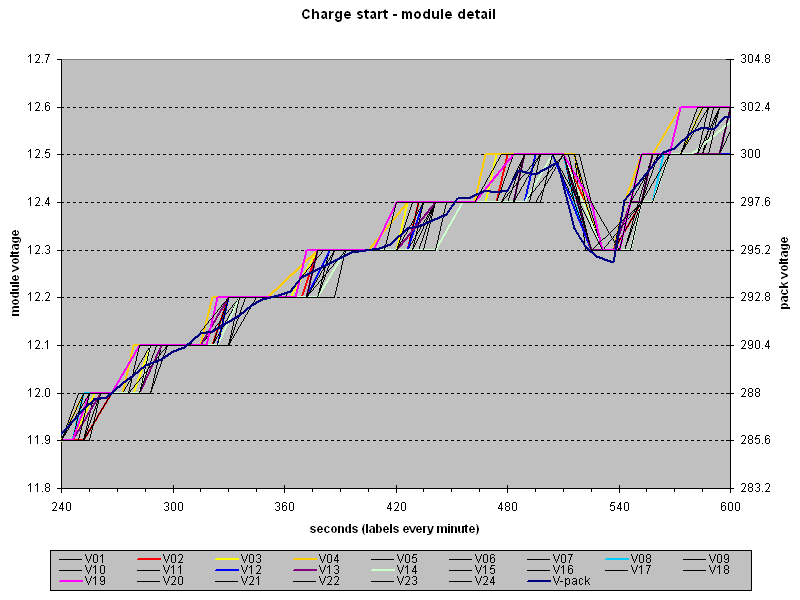
This graph shows how pack and module voltages changed during the first several minutes of the charge.
It's interesting that the 'weak' modules are first to increase voltage here.
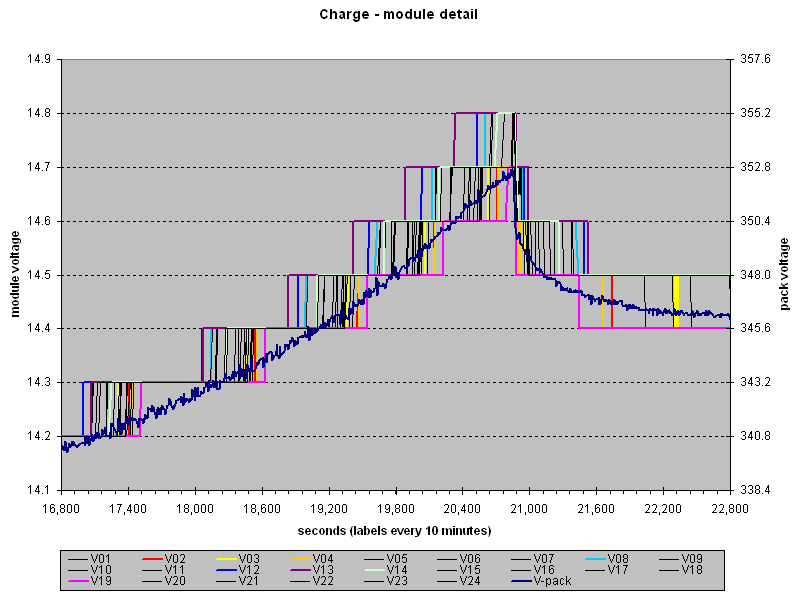
This graph shows pack and module voltages around the time of transition to leveling.
By this time the 'strong' modules are the first to increase voltage.
Thoughts
Some things we thought were interesting...
During discharge, the pack voltage stair-steps consistently, but those changes don't correlate especially well with the changes in module voltage. The pack voltage changes could be based on expectations of module changes or possibly using an internal module measurement that has higher precision than the car's computer reports to the tester.
In contrast, the pack voltage increases more steadily during charging, although with some jaggedness.
The SOC increases at a very stable rate during charging. We've also observed this on subsequent partial charges.
There is a dramatic increase in temperatures as SOC approaches 100%. It's our understanding that full charge for NiMH is determined by this temperature increase, not by a specific voltage level.
| Electric Vehicles | Overview | FAQ | Efficiency Analysis | Driver Resources |
|
©1996-2026 Tom and Cathy Saxton. You may not copy or reproduce any content from this site without our consent.